


Improve field performance with easy-to-read analytics
Streamlined monitoring for operational problem-solving
FEATURE
HIGHLIGHTS
FEATURE HIGHLIGHTS
- Monitor performance and frequencies
- Graph collected data in an easy-to-interpret format
- Gain visibility into field activity
THE PROBLEM
Without a mobile field service app like TrueContext, gathering job and asset data remains a complex and labour-intensive task. With paper-
based submissions, critical information is often lost or not captured at all. This lack of visibility can lead to missed revenue or process improvement
opportunities.
Say a business hopes to elevate poor customer satisfaction scores. Without access to critical field data, it is difficult to test hypotheses, discover root causes, and find appropriate remedies.
OUR SOLUTION
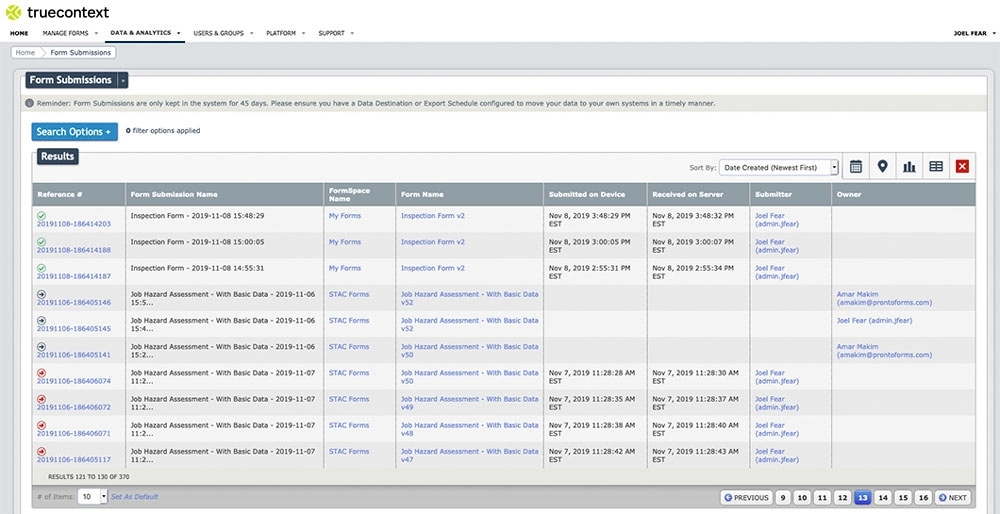
Our out-of-the-box Basic Analytics feature allows users to plot responses to specific questions on a graph to help test hypotheses.
In the below example, perhaps the LOB leader assumes that poor satisfaction scores are due to late technicians.
With Basic Analytics, they can plot submissions over a specified time period – in this case, the past month – in a sleek graph. According to the corresponding visual, the LOB leader can determine the validity of his assumption by checking answers to the question of late technician arrival, which shows “Yes” three out of nine times. With this information, they can not only consider an on-time arrival improvement program but also monitor the results of that program.

The field is offline.
Are you equipped for it?
Ensure that your teams continue to collect field data regardless of wireless coverage, so your LOB leaders can have the most accurate and complete analytics.
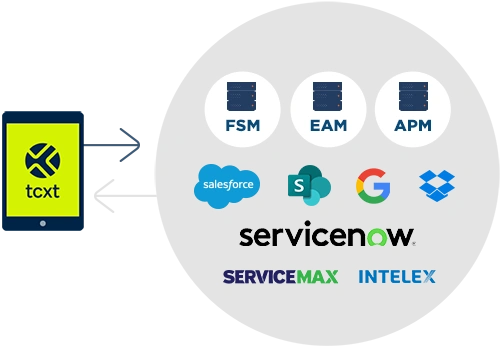
Unified data, actionable intelligence
Seamlessly integrate TrueContext with your CRM, EAM, and FSM platforms to achieve a single source of truth across your organization and enable faster business decisions.
Ready to unleash productivity?
Book a 15-minute chat to learn how you can make TrueContext work for you.